How to Debug in Python
Smart debugging with the interactive python debugger, ipdb


Many times when working with python, you’ll hit a wall and struggle to figure out why a function isn’t working. A common basic approach to debug is to use print statements, but this can be tedious and time consuming. Fortunately, there is a better way to debug your python code: the interactive python debugger, ipdb.
In this article, we’ll discuss the basics of ipdb and how to use it to debug your python code.
What is ipdb?
ipdb is an interactive python debugger that allows you to step through your code line by line. It allows you to inspect variables and their values, set breakpoints, and even execute code on the fly. It’s a powerful tool for debugging python code and can save you a lot of time and frustration.
How to use ipdb
I’ll explain how to use ipdb using an example you might come across in a data science application. Imagine you are trying to transform your data with a log function, but are encountering a case where an error is raised:
import math


def log_transform(x):
  return math.log(x)


log_transform(5)
log_transform(0)
Here, you will encounter a math domain error like so:
ValueError: math domain errorbut you may not immediately realise why. If we install ipdb with pip:
pip install ipdbWe can then use ipdb to debug our code. To do this, we’ll insert a breakpoint at the line where the error occurs. We can do this by adding the following line to our code:
import ipdb; ipdb.set_trace()Thus, your script (we’ll name test_program.py) will change to the following:
import math
def log_transform(x):
import ipdb; ipdb.set_trace()
return math.log(x)
log_transform(5)
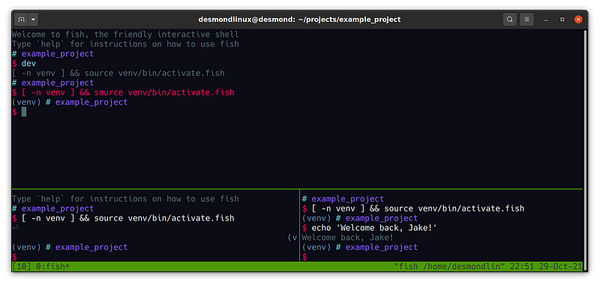
log_transform(0)Now, when you run the code with python test_program.py, you’ll be taken to the ipdb prompt. This is where you can inspect the values of variables and step through the code line by line.
At the ipdb prompt, you can also type help to get a list of commands. The most useful commands are list, step, next, continue, print, and quit.
You can also type help followed by a command to figure out what that command does. For example, help list will give you a description of the list command. Let’s take a look at our example.
We can type list to see the code around the breakpoint. We can then type step to step into the function, next to move to the next line, and continue to continue running the code until the next breakpoint. We can also use any python code to figure out what is happening. For example, we can use print to print out the value of a variable. If we type print(x), we’ll see the value of the variable x.
By using ipdb, we can quickly identify the source of the error. In this case, if we use the continue command to go through the first log_transform with an argument of 5, we see that the function runs fine. If we type continue again, we’ll see that the error occurs when we try to run the function with an argument of 0.
We can also narrow this down by getting into the interactive debugger again with python test_program.py, going to the second time the function is called with continue , testing what the argument x is with print(x) and testing the commandmath.log(x) with all the variables available at that specific line of code (x equal to 0). This workflow really helps with more complex cases and applications where you may have many variables that could potentially be the problem.
We have now narrowed down the reason for the error by adding one line of code and interactively using the debugger. If we do some research, or this brings up some prior knowledge of log, we will find that the reason for the error is that the log function is not defined for 0. We can then add some code to make this more obvious for us in the future or other programmers we work with using a smart error check, e.g.
def log_transform(x):
  if x == 0:
    raise ValueError('Log function is not defined for 0')
  return math.log(x)
Using ipdb can save yourself a lot of time and frustration. So the next time you hit a wall while programming with python, give ipdb a try and see how it can help you debug your code.